
These Three Charts Show Why You Need to Own Stocks
Cash may seem safer, but even amid uncertainty in the market, owning stocks is the much better long-term strategy.

Since launching This Is Fine, I’ve shared a few reasons to be cautious on the stock market in the short term.
The U.S. economy and consumer are on shaky ground, depending on what metrics you’re looking at… savings are down and delinquencies are up… and investors are greedy, not fearful.
Still, over the long run, stocks are the place to be. It always has been, and I’d bet that if your investment horizon is long enough, it always will be.
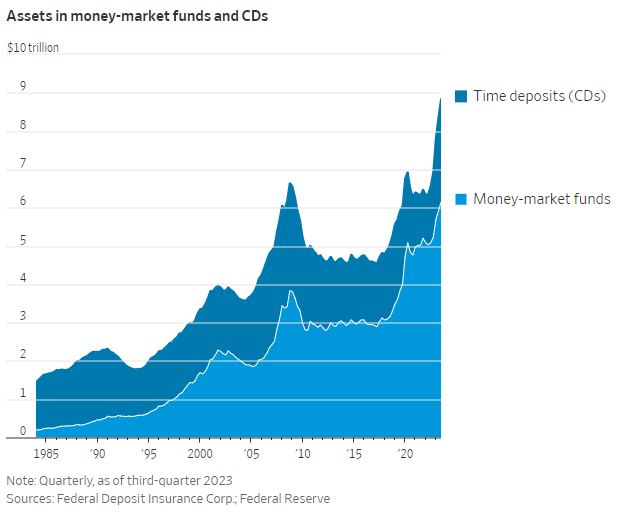
Last week, the Wall Street Journal reported that Americans are sitting on a record amount of cash:
Rising interest rates drew trillions of dollars into money-market funds and other cash-like investments in the past two years, with more than $8.8 trillion parked in money funds and CDs as of the third quarter of 2023.
Here’s the chart the Journal showed:
Now, holding some “dry powder” is always prudent, and I would never suggest you invest 100% of your portfolio. But the excellent Charlie Bilello shared a few charts recently that show exactly why holding cash — too much of it, and for too long — can be disastrous for your investment returns.
First, Bilello shows that even over a 1-year period, cash only has a 31% chance of outperforming stocks (as measured by the blue-chip S&P 500). That number falls to 26% in two years and 22% in three years:
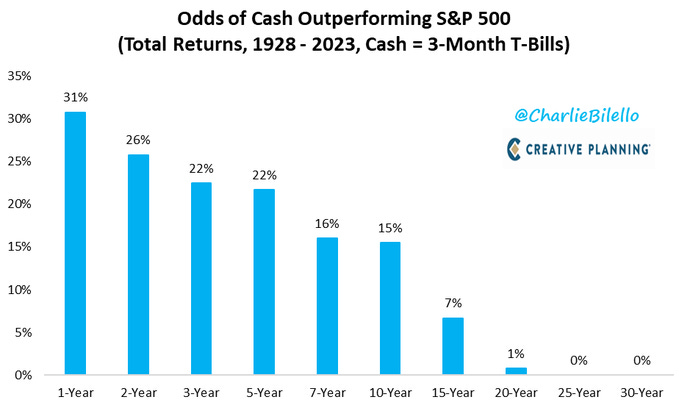
In other words, if you have at least 3 years to invest, there’s a 78% chance that stocks will outperform cash.
The next two charts draw the same conclusion but present the information in different ways.
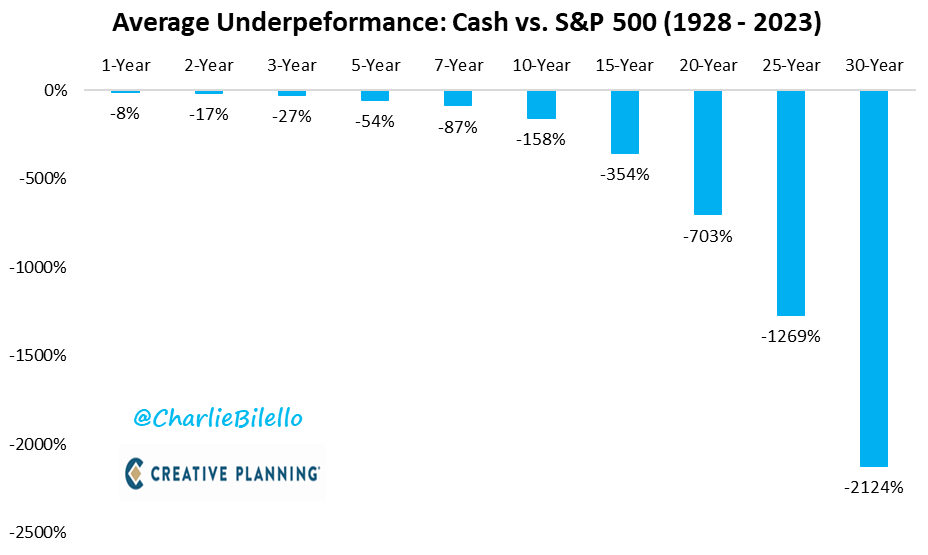
Bilello shows the underperformance of owning cash instead of stocks going back 95 years. As he explains…
What does sitting in cash cost you? Sometimes nothing, when equity markets are going down. This is particularly true during long bear markets.
But much more often, it is costing you something, with that something increasing as the years go by. Over 1-year periods the average opportunity cost of holding cash has been roughly 8%. But over 30-year periods, this grows to 2,124%.
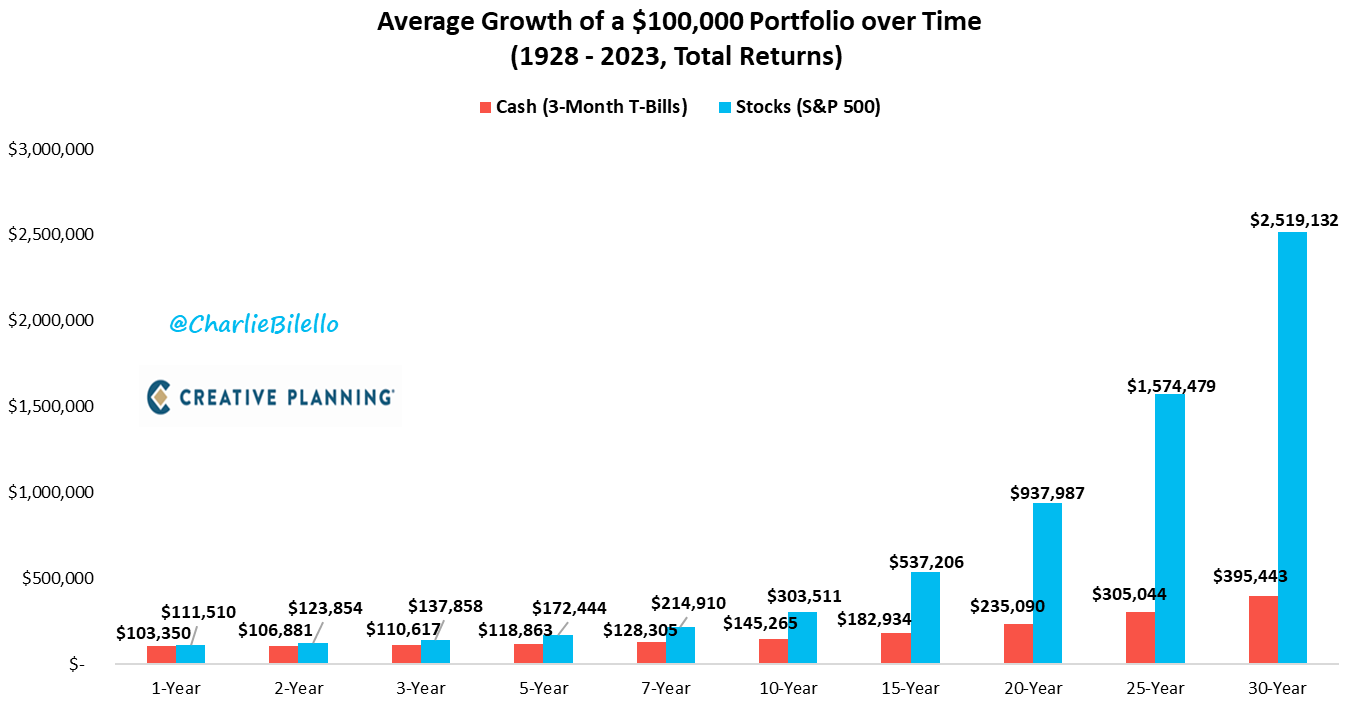
Finally, Bilello showed what would happen if you had a $100,000 portfolio and parked it in cash (3-month Treasury bills) versus investing it in the S&P 500 over the same time frame.
Over 30 years, $100,000 parked in cash turns into nearly $400,000. The same portfolio invested in the S&P 500 for 30 years is worth more than $2.5 million — outperformance of more than 6 times:
Regardless of how shaky things look over the coming months, these charts prove that for the vast majority of investors, the stock market is the place to be.
That’s why I continue to recommend buying stocks, even today, for anyone who plans to stay invested for at least a few years.
Especially when the central planners are actively devaluing cash and pushing it into the stock markets to prop up the system.